Bollinger bands indicator was created by a financial analyst John Bollinger in 1980s. Bollinger bands are a complex technical analysis indicator which calculation is based on the volatility of the market (similar to Keltner channel indicator or Donchian channel indicator). The main idea behind the indicator is that it highlights the overbought and oversold conditions on the market but yet some other traders use it to identify strong trends (so as a matter of fact they use it as a trend-following indicator).
| Price | Average price | Pi - PAVG | (Pi – PAVG)2 | (Pi – PAVG)2 x 1/N |
| 100 | 70 | +30 | 900 | 300.00 |
| 80 | 70 | +10 | 100 | 33.33 |
| 30 | 70 | -40 | 1600 | 533.33 |
| ∑ | 866.66 |
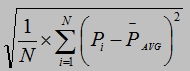
The number 866.66 is the variance of these prices. You can calculate the standard deviation as the square root of the variance, so in this case the standard deviation equals to 29.44. If you still don’t understand the calculation, don’t worry it is also one of the Excel functions.
Middle curve = Simple moving average
Upper band = SMA + (2 * Standard deviation)
Lower band = SMA – (2 * Standard deviation)
How to use the indicator in technical trading:
The theory that lies behind this indicator says that in 68.2 % of the time the price should move inside the bands when they are created from SMA ± (1 * Standard deviation). It also applies that if you double the standard deviation the price should move inside the bands in 95.4 % of the time. If you triple the standard deviation the price should move inside the Bollinger bands in 99.6 % of all the time.
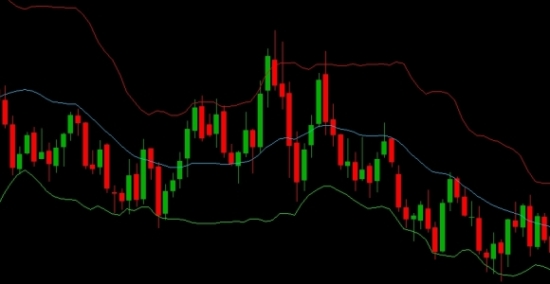
Now it is quite easy to figure out how to use the Bollinger bands indicator. We use double the standard deviation so 95.4 % of the prices should move inside our bands. Only 4.6 % of prices should move outside them. If they do so it is considered to be an extraordinary situation that can’t be lasting long and the prices should get back into the limits soon. All this probability theory and statistics rules applies to normal distribution. There is a discussion whether the underlying assets prices and the low number of days (used in the Bollinger bands calculation) can be considered for normal distribution. Well, the truth is that various practical researches proved that the probability of staying prices inside the bands can be lower – e.g. not 95.4 % of the time, but just 85 % - 90 % of the time. Maybe that is the reason why some traders prefer not to choose double the Standard deviation but even triple it. Then they can get much more reliable signals to go short or long. In later years John Bollinger introduced three other variations of Bollinger bands. They are called: Impulse BB, percent Bandwidth (%B) and Bandwidth delta. The next image shows how the Bollinger bands looks in a candlestick chart.
Signals when to buy and sell:
The use of Bollinger bands indicator varies a lot. It is commonly used as an oscillator that should identify the oversold and overbought conditions on the market. That means when the price gets above (or even touches) the upper band it gives a signal that the price is too high (the market is overbought) and the time has come to go short. There is increased probability that the price will get back below the upper band and even go lower. In other words, after touching or overcoming the upper limit the price starts to decline and later it even touches the middle Bollinger band (simple moving average). This is a form of price correction that can come either in ranging market or in strongly trending market, doesn’t matter. But after all there is a difference. While in strongly trending market the price will probably go back to the Middle Bollinger band and then it bounces again upwards, in ranging market there is more probable that the price will break through the Middle band and even continue to the other (lower) band. We can simplify this and say that in trending market the price will probably move between the Simple moving average and one of the bands. In ranging market the price will probably move between both bands, sometimes it bounces back from the middle, sometimes it breaks through it.
As mentioned at the beginning of this article, some traders don’t use it for identifying overbought and oversold market conditions but as a trend-following indicator. They wait while price breaks through the upper or lower band (in ranging market) and take it as a signal that a new trend has just begun (in other words that the long-lasting war between bulls and bears has just been won by one of these groups and that is the reason why the price has broke the upper or lower band).
As there is many ways how to use the Bollinger bands and some of them are opposed, traders who don’t want to rely just on this indicator use to combine it with some other indicators. There were some trading systems tested with ADX indicator (ADX identified the strength of the trend while Bollinger bands provided signals to buy or sell at the right time). Some other people prefer to combine it with chart patterns like supports and resistances, price channels and others.
Despite Bollinger bands indicator is already one of the most popular indicator among traders in our opinion it offers great opportunities to develop it even further. E.g. some traders already adapted the indicator when they used Exponential moving average instead of the basic Simple moving average. But it would be even more interesting to combine and test it with KAMA indicator. Unlikely the Simply moving average or Exponential moving average the KAMA indicator is based on the market volatility as well (as the Bollinger bands is) so it could generate very interesting signals. VIDYA indicator or Variable index dynamic average is another moving average that uses market volatility for its calculation. The opportunities how to develop the Bollinger bands indicator are almost unlimited.
As with almost all of the technical indicators the best thing every trader can do is to test his own data, his own settings, and his own rules how to trade. Surprisingly, sometimes the best result can be achieved with settings that are not common and rules that are quite strange at a first glance – the more things a trader can change and experiment with the better for him and his trading results. If you are interested in a deeper study of the indicator the following link leads to the technical indicators in Excel files for download.